An official website of the United States government
The .gov means it’s official.
Federal government websites always use a .gov or .mil domain. Before sharing sensitive information online, make sure you’re on a .gov or .mil site by inspecting your browser’s address (or “location”) bar.
This site is also protected by an SSL (Secure Sockets Layer) certificate that’s been signed by the U.S. government. The https:// means all transmitted data is encrypted — in other words, any information or browsing history that you provide is transmitted securely.
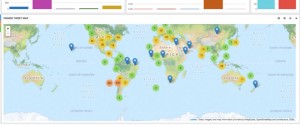
Case Studies
The Aggregative Contingent Estimation Program | Predicting Global Events Through Crowdsourcing